Beyond the Backtest

Developing case study · Systematic strategy validation

Beyond the Backtest

How Lucitech moves a systematic trading candidate from structured
discovery through broker-aligned historical testing, independent
evidence gates, controlled deployment and live observation.

Candidate focus: EUR/USD intraday mean-reversion
Signal horizon: 30 minutes
First publication: 19th July 2026
Last revised: 20th July 2026

About this case study
This developing case study assembles evidence produced at different
stages of the candidate’s research and operation. The evidence was not
created solely for publication and may include results from earlier
research runs. Every result is identified by its applicable evidence
date or run identifier. Historical results are presented as one layer
of evidence—not as proof of future profitability.

A persuasive backtest is easy to produce. A defensible decision to
continue researching, approve or cautiously deploy a systematic
strategy is much harder.

This case study documents the evidence lineage of one Lucitech
candidate. It does not disclose the complete strategy, winning
parameter values or a reproducible optimisation recipe. Its purpose is
to demonstrate the process used to decide whether evidence is strong
enough for a candidate to advance—and when it should stop.

1 · The problem

A persuasive backtest can still be wrong

A historical result describes what a particular configuration did
against a particular dataset under particular assumptions. It does not,
by itself, establish what will happen next.

Selection bias

If enough configurations are tested, some will look successful by
chance. Selecting the best result without accounting for the wider
trial population can turn luck into an apparently compelling
strategy.

Overfitting

A configuration can become too closely adapted to the precise
historical period used to find it. It may describe past noise
exceptionally well while failing on new data.

Information leakage

A test becomes unreliable if information that would not have been
available at the decision point accidentally influences the signal,
parameter selection or validation process.

Execution assumptions

Attractive results may disappear when spread, slippage, latency,
financing, fill behaviour and other operating frictions are more
realistically represented.

Regime dependence

A candidate may work only during a particular volatility, trend or
liquidity regime. Aggregate performance can conceal long weak
periods or dependence on a small number of favourable episodes.

Insufficient observations

An extreme profit factor or smooth equity curve can be produced by
very few trades. Small samples provide little evidence about the
range of outcomes the strategy may encounter.

No single metric constitutes proof.
Return, profit factor, Sharpe ratio, drawdown and the equity curve each
describe part of the result. None establishes that the apparent edge is
repeatable, operationally viable or likely to survive new market data.

The hypothesis under examination

The candidate considered here belongs to a generic intraday
mean-reversion strategy family operating in EUR/USD on a 30-minute
signal horizon.

The first-phase implementation is deliberately bounded. Entries are
evaluated from 30-minute market data and, once a position is opened,
static profit-target and stop-loss levels govern the trade. A possible
later research phase may examine tick-based stop management informed by
maximum favourable excursion and maximum adverse excursion evidence.
That later work is not part of the result documented here.

A governed evidence sequence

Lucitech treats optimisation as the beginning of an investigation,
rather than its conclusion. A candidate must move through a recorded
sequence of evidence gates.

01
Discover

Structured Optuna search evaluated through the JForex historical
tester.
02
Validate

Reproduction, out-of-sample testing, population analysis and
robustness challenges.
03
Approve

Evidence is reviewed against explicit gates before a candidate can
progress.
04
Deploy

Controlled shadow-demo observation precedes or accompanies
tightly bounded live operation.
05
Observe

Runtime health, trades, execution parity and evidence drift remain
under telemetry.

Figure 1 — Lucitech’s evidence pipeline records whether a candidate
advances, stops or returns for further investigation at each gate.
2 · Candidate discovery

Broker-aligned historical testing

Each Optuna candidate is evaluated through Lucitech’s headless JForex
testing path rather than through a detached spreadsheet or simplified
candle-only simulator.

A code-level audit of the runner confirms that the target instrument is
subscribed, historical data is downloaded and the test is configured
with
ITesterClient.DataLoadingMethod.ALL_TICKS
before the strategy is started through the JForex tester client.

This means candidate selection takes place through the project’s
broker-platform testing route using the same core strategy
implementation employed by the deployment path. It provides a more
broker-aligned historical evaluation than a separate simplified
simulator.

A carefully bounded claim
Historical tick loading is not equivalent to future live execution.
Realised spread, liquidity, latency, slippage, order routing and
financing conditions may differ. At this publication stage, Lucitech
therefore claims broker-aligned historical evaluation—not replication
of every future live cost or fill.

Further information:

Dukascopy JForex Historical Tester documentation
.

2.2 · Disclosure boundary

Evidence transparency without publishing the strategy

Lucitech publishes enough information to make the research discipline
understandable and reviewable, while withholding the combination of
details that would make the strategy search directly reproducible.

Area Published Withheld
Framework Optuna-led structured parameter discovery and JForex historical
evaluation.
Custom implementation details that would reconstruct the search.
Parameters Broad parameter categories and the reason those categories are
investigated.
Exact feature definitions, complete ranges and winning values.
Scoring Broad score components, their purpose and the kinds of fragility
penalised.
Exact formula, weights, thresholds and ranking rules.
Results Trial populations, distributions, representative results and
candidate progression.
Full trial databases and deployment-ready parameter files.
Validation Evidence gates, material outcomes and reasons for progression or
rejection.
Details that would reveal or reproduce the executable edge.

Any individual value may be harmless in isolation. The complete
combination of feature definitions, parameter ranges, objective
function, penalties, thresholds and winning configuration can amount
to a reproducible search recipe. That recipe forms part of Lucitech’s
research and strategy intellectual property.

3 · Validation

A candidate has to survive new evidence

The historical result establishes a candidate for investigation. The
next question is whether its behaviour remains defensible when the
original search conditions no longer control the test.

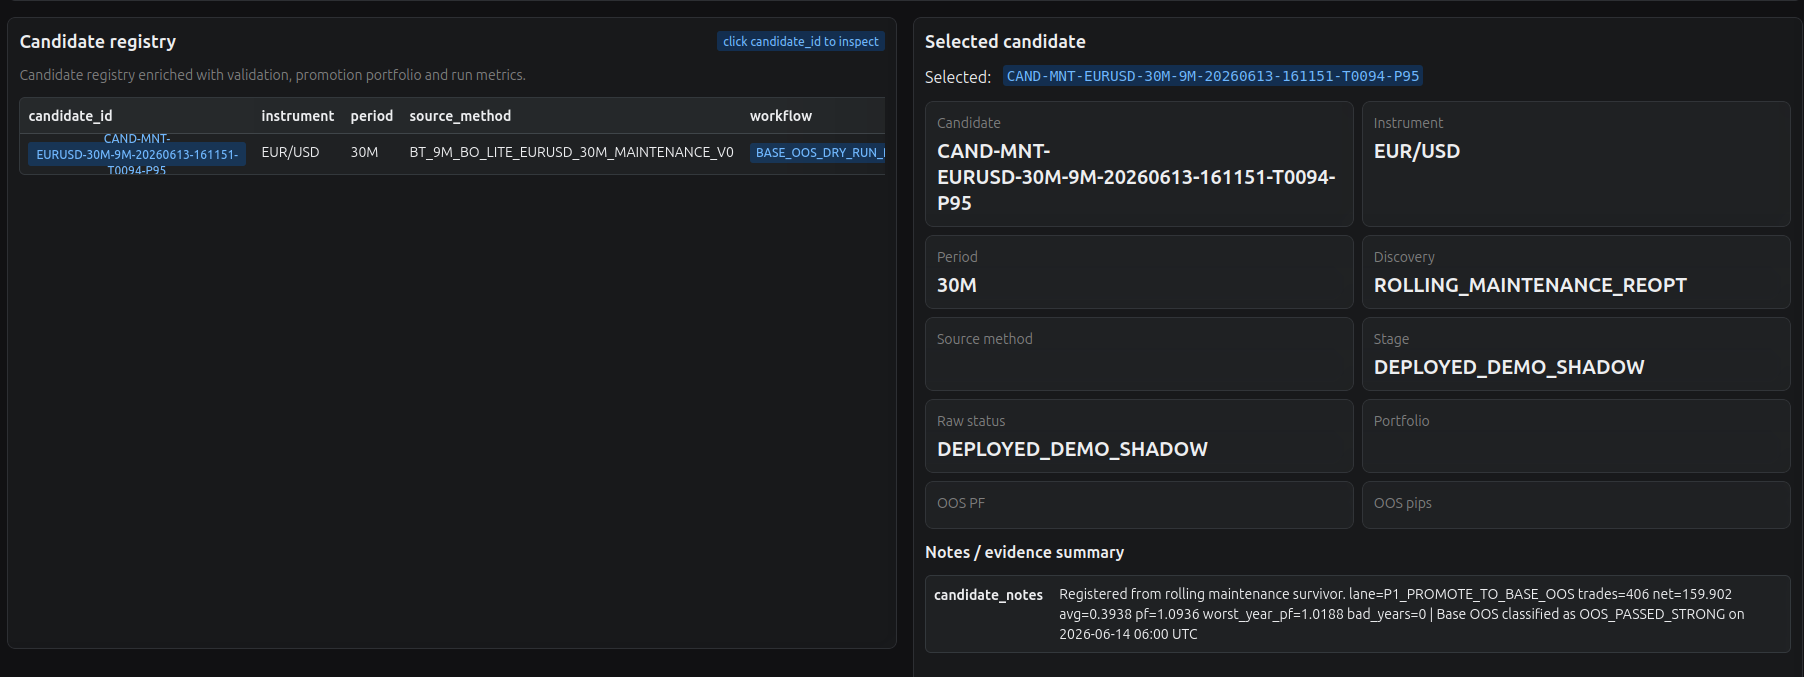
The Workbench candidate record links T0094/P95 to a nine-month rolling
maintenance source dated 13 June 2026. Its evidence summary records 406
trades, 159.902 net pips, an average of 0.3938 pips per trade and a
profit factor of 1.0936. It also records a worst-year profit factor of
1.0188, no negative years in that evaluation, and classification as
OOS_PASSED_STRONG on 14 June 2026.

These values remain modest. Their importance is not that they prove a
durable edge, but that the candidate identity, source evidence and
subsequent decision are retained as a traceable record. The later July
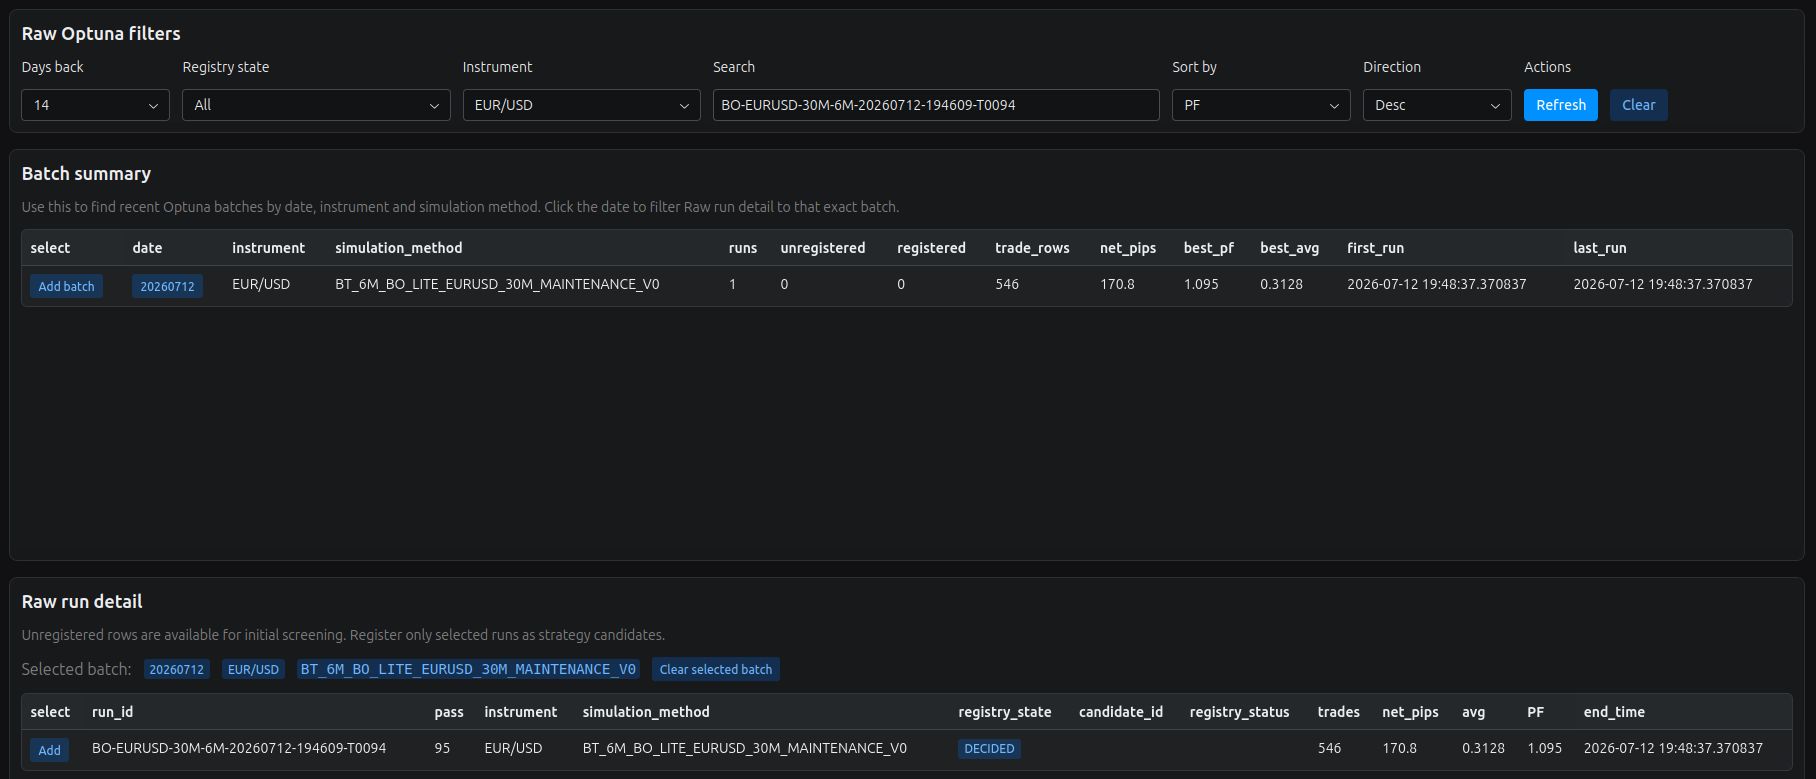
maintenance result shown above is a separate evaluation associated
with the same T0094/P95 parameter lineage.

Historical robustness

  • Replay and reproduction of the selected configuration
  • Out-of-sample testing
  • Trade-count and outcome-distribution review
  • Weak-period and adverse-regime analysis
  • Parameter-neighbourhood and stability challenges

Operational evidence

  • Forward demo-shadow observation
  • Controlled micro-lot deployment
  • Demo and live execution comparison
  • Runtime health and data-freshness telemetry
  • Continued drift and exception monitoring

Lucitech Candidate Registry showing the EUR/USD 30-minute T0094/P95 candidate, its evidence summary and deployed demo-shadow stage.
Figure 3 — Database-backed candidate identity and evidence
record.

The Workbench links T0094/P95 to its nine-month rolling-maintenance
source, records 406 trades, 159.902 net pips and a profit factor of
1.0936, and preserves its OOS_PASSED_STRONG
classification before demo-shadow deployment.

4 · Controlled deployment

From demo-shadow evidence to live micro-lot observation

On 14 July 2026, the T0094/P95 lineage entered controlled EUR/USD
micro-lot operation alongside its corresponding demo-shadow benchmark.

The deployment uses fixed micro-lot sizing. It does not employ an
undisclosed post-selection rule pack or additional runtime veto layer.
The active controls are part of the base strategy configuration,
including signal conditions, spread control, static stop and target,
and a bounded holding period.

The purpose of this deployment is evidence collection. It allows
Lucitech to compare expected behaviour with shadow and live
observations while strictly limiting financial exposure. Entry into
live micro-lot operation should not be interpreted as a claim of
validated profitability.


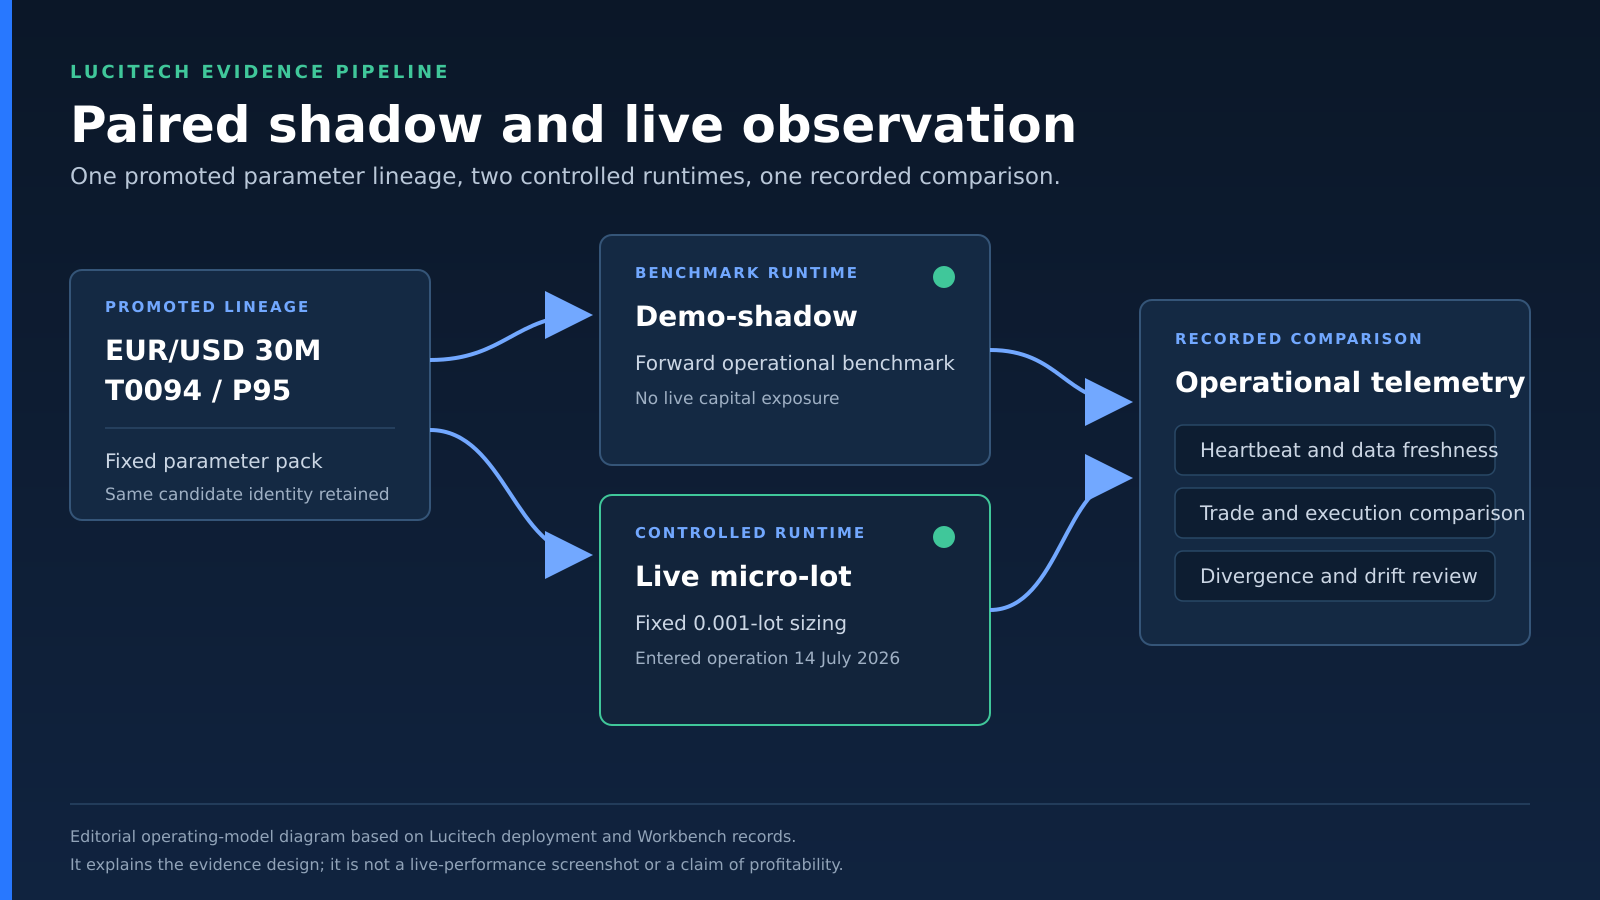
Diagram showing the EUR/USD T0094/P95 parameter pack feeding paired demo-shadow and live micro-lot runtimes for telemetry comparison.
Figure 4 — Paired operational evidence model.
The promoted T0094/P95 parameter lineage operates through a
demo-shadow benchmark and a controlled fixed-size live micro-lot
runtime. Lucitech compares their telemetry for data freshness,
execution behaviour and divergence. This editorial diagram describes
the operating model; it is not a live-performance result.
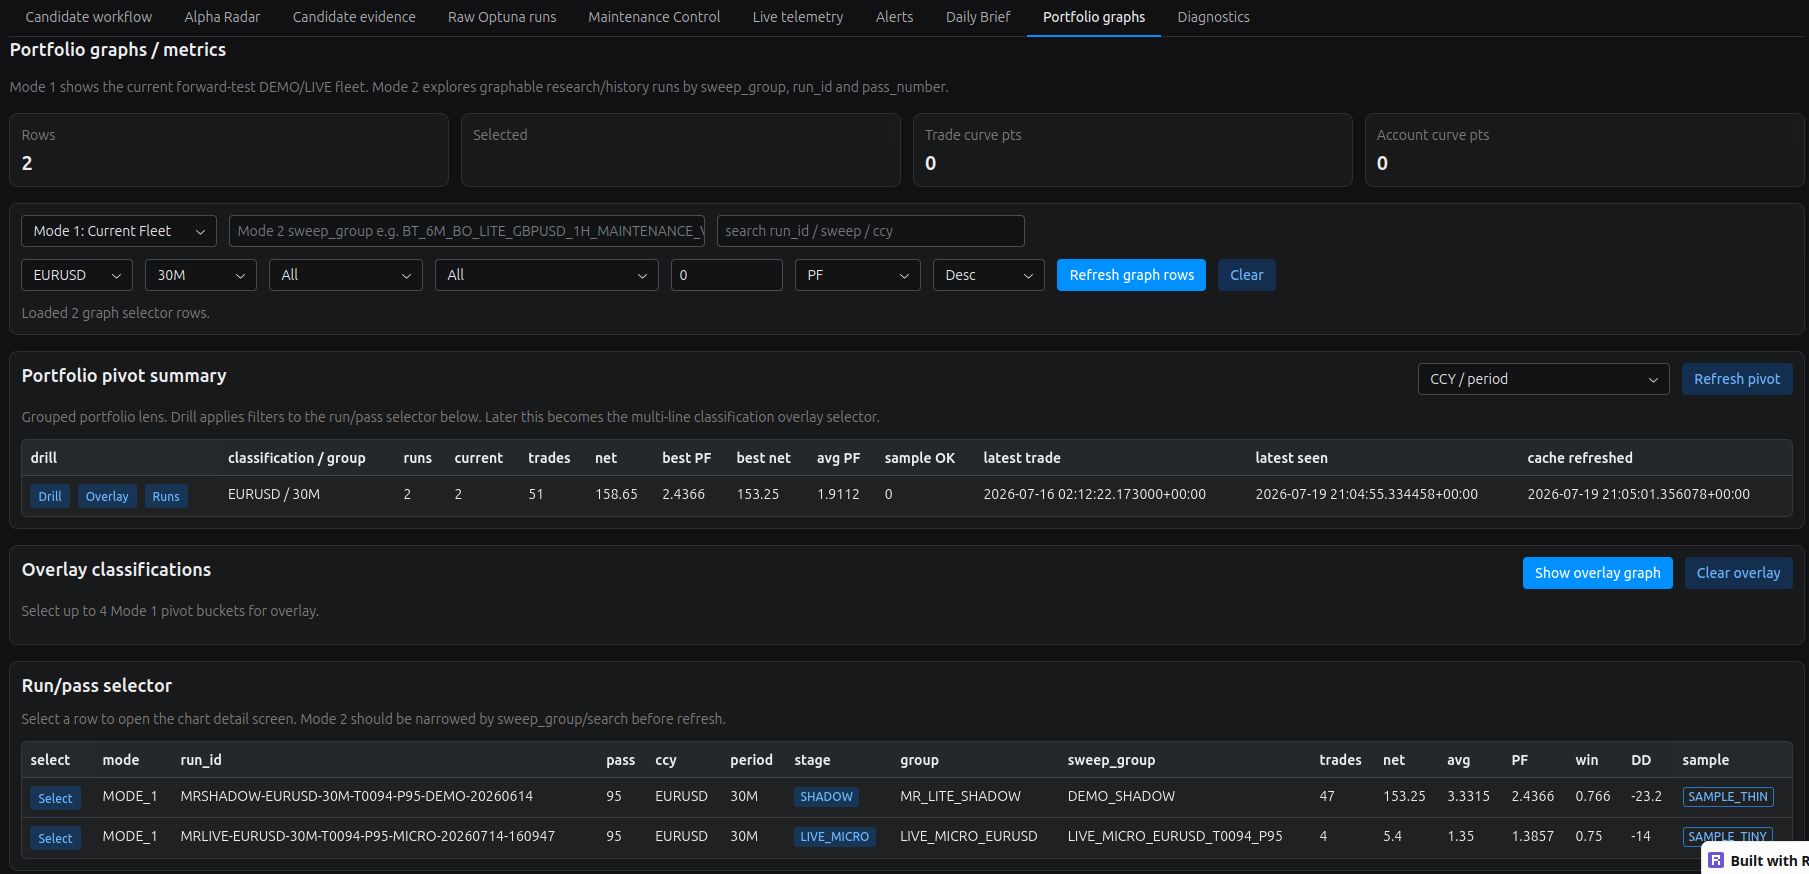
Lucitech Alpha Workbench showing paired current EUR/USD 30-minute T0094/P95 demo-shadow and live micro-lot runtime records.
Figure 5 — T0094/P95 paired forward-operation record.
At the stated evidence date, the Workbench identifies two current
EUR/USD 30-minute runtimes sharing parameter-pack 95: the established
demo-shadow benchmark and the controlled live micro-lot deployment.
Their run identities, operational classifications, trade counts and
telemetry timestamps are recorded separately. Both samples remain
explicitly classified as thin; these early metrics establish
operational linkage, not performance parity or durable profitability.

5 · Developing record

What will be added next

Later revisions will extend the record as additional evidence becomes
suitable for publication.

Validation results

Out-of-sample outcomes, robustness challenges and the reasons the
candidate was permitted to advance—or required to stop.

Forward comparison

Comparison of historical expectations, demo-shadow behaviour and
controlled live-micro observations over a meaningful sample.

Operating evidence

Runtime availability, heartbeat and market-data freshness,
execution observations, exceptions and evidence drift.

Interpretation boundary
Lucitech does not present historical or early live results as an offer,
investment recommendation or guarantee of future returns. Systematic
trading involves risk, and a strategy that performed positively in
historical or limited live observation may subsequently lose money.

Research updates

Follow the evidence as the case study develops

Receive occasional Lucitech research and engineering updates as new
validation stages are documented. You may optionally tell us about
your current or proposed systematic trading work. Please do not
include confidential strategy details or proprietary parameters.

Subscription frequency: occasional. Every message should provide an
unsubscribe route. Personal information should be processed in
accordance with the Lucitech privacy notice.

This website uses cookies to analyze site traffic and improve your experience. By continuing to use this site, you consent to our use of cookies.