VERTICAL DEPTH
Following one candidate
A candidate retains its identity as it advances through discovery,
replay, out-of-sample review, promotion decisions, shadow operation
and live telemetry.
Systematic trading research, validation and engineering
A systematic research platform must support more than one promising
backtest. It must process multiple instruments and candidate
configurations while preserving provenance, separating raw results
from approved candidates and retaining evidence of failure as well
as success.
The T0094/P95 case study demonstrates depth: one EUR/USD candidate
can be traced from discovery through validation, shadow observation
and controlled live micro-lot operation. The wider research estate
must also support breadth—processing many configurations, batches
and instruments through a common evidence workflow.
A candidate retains its identity as it advances through discovery,
replay, out-of-sample review, promotion decisions, shadow operation
and live telemetry.
The same infrastructure receives results from multiple searches,
instruments and historical windows. Each batch must remain
identifiable without treating every apparently attractive result
as a viable strategy.
The Workbench view below records 478 raw Optuna runs in the selected
14-day window. The visible batches span EUR/USD, EUR/JPY and USD/CHF,
with individual batches containing as many as 134 candidate
configurations and tens of thousands of associated trade rows.
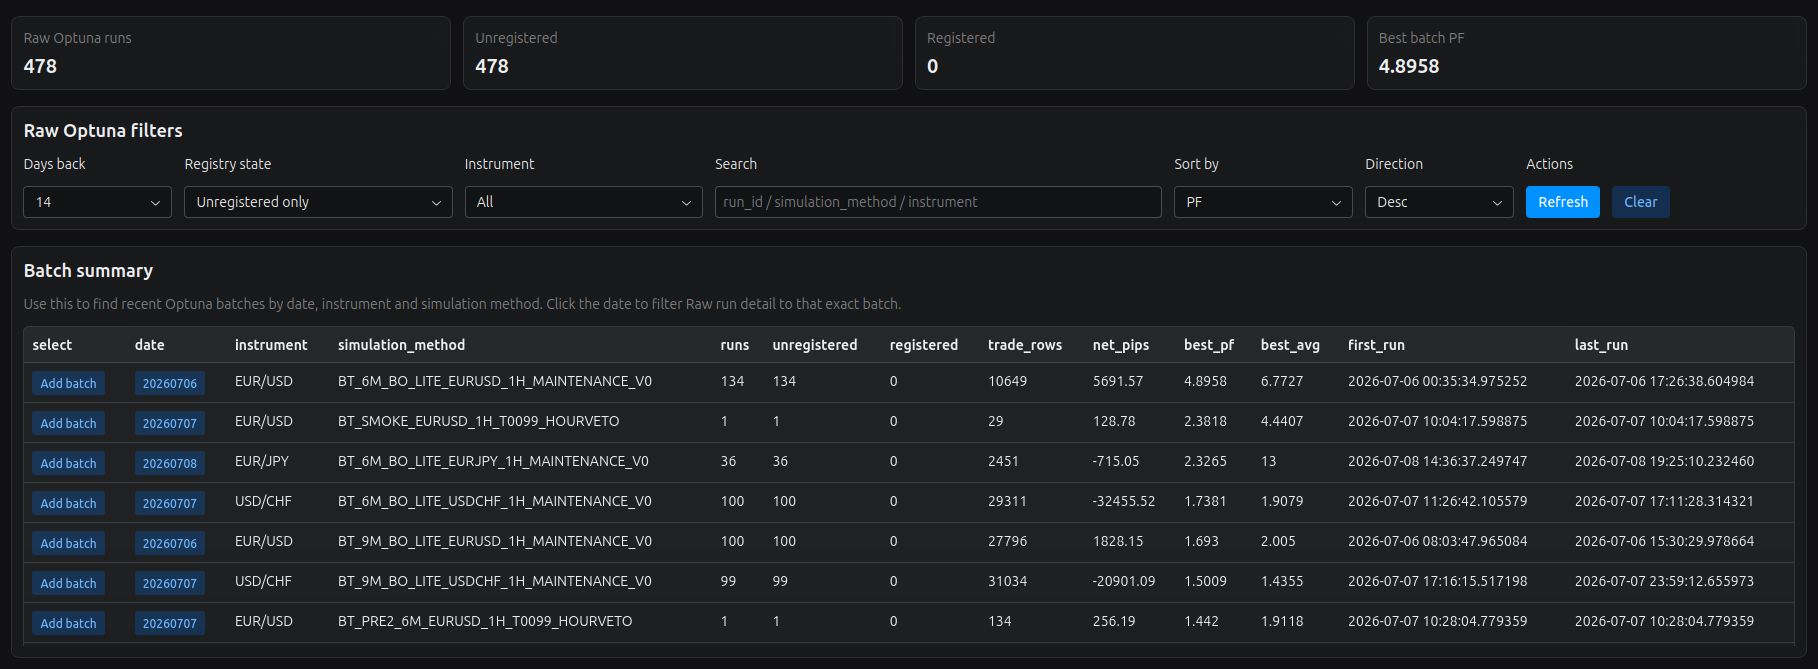
The displayed totals describe a selected historical research
window. They are not performance claims, capacity guarantees or
evidence that every raw configuration was independently viable.
Producing more backtests increases the need for evidence discipline.
A large search can discover interesting configurations, but it also
creates more opportunities to select an attractive result by chance.
Results enter the Workbench with their batch, instrument,
simulation method and completion information. Intake preserves
what happened; it does not imply approval.
Profit factor, average trade and net performance must be read
alongside trade density, temporal distribution and the conditions
under which the result was produced.
Only selected configurations become governed candidates.
Registration creates a traceable research object for additional
validation; it is not an automatic deployment decision.
The screenshot deliberately retains the Workbench’s raw
Best batch PF field. This is an intake statistic, not a claim
about expected future performance.
Profit factor can appear unusually high when it is calculated
from a small number of trades. A favourable short sequence may
dominate the result without demonstrating repeatability across
time or changing market conditions.
Subsequent screening can require minimum trade density and examine
stability across periods before a result is considered for
registration. The raw intake view remains useful because it
preserves the original result rather than rewriting the research
record.
A formal capacity study would measure wall-clock processing time,
trials per hour, worker concurrency, resource consumption and database
behaviour as workloads increase. The present evidence supports the
narrower claim that Lucitech has demonstrated repeatable,
multi-instrument research throughput inside a common evidence system.
The commercial value is not simply the ability to run an optimisation
sweep. It is the integration of broker-aligned historical testing,
structured intake, candidate registration, validation evidence,
controlled promotion and operating telemetry.
Read the developing T0094/P95 case study to see how one candidate
moved from research output into validation, demo-shadow observation
and controlled live micro-lot operation.