Appendix A — Optuna Dashboard Artefacts: EURUSD 1H Candidate T0012
The following screenshots are cropped Optuna Dashboard artefacts from the EURUSD 1H generic scout study. They document the discovery-stage provenance for candidate T0012 and illustrate how the Workbench links Optuna trial output to downstream SQL, clustering, walk-forward, and execution-engine validation.
These figures are included as process artefacts only. They do not constitute validation of deployable alpha.
Figure A1 — Optuna Study Registration
Figure A2 — Trial-Level Provenance for EURUSD 1H T0012
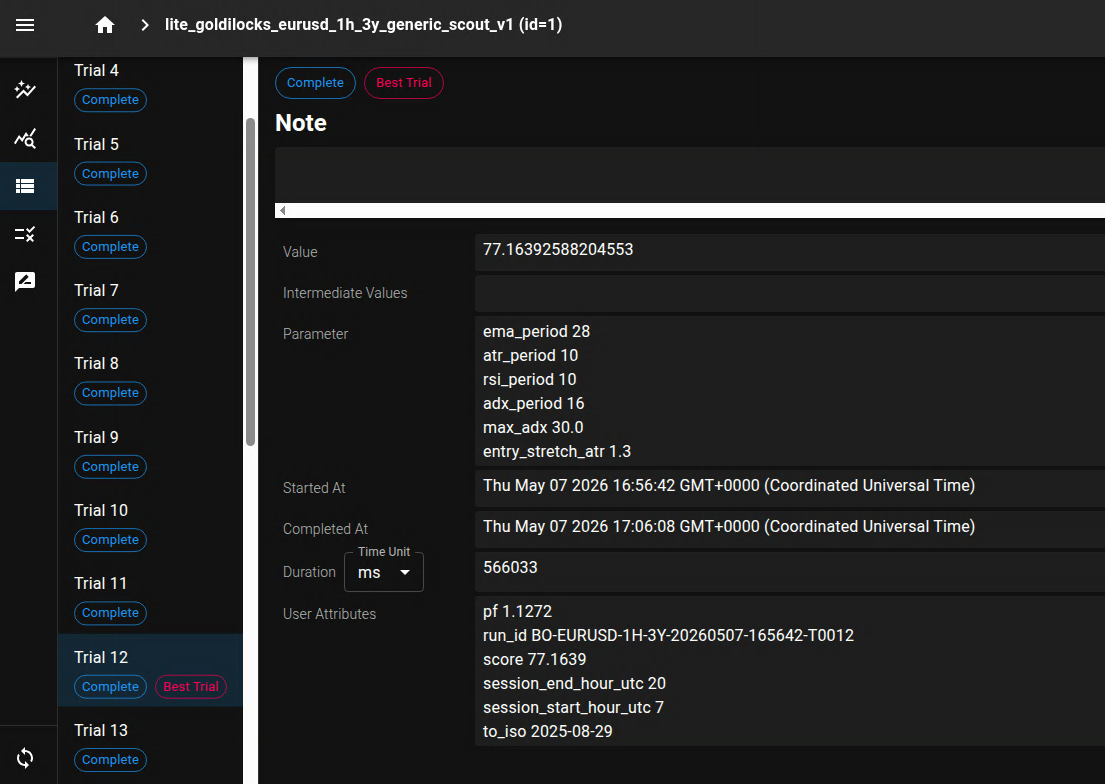
The visible sampled parameter set includes:
θ12 = {ema_period=28, atr_period=10, rsi_period=10, adx_period=16, max_adx=30.0, entry_stretch_atr=1.3, …}
The associated discovery-stage result vector is summarised as:
R12 = {N=1195, P=860.66, p̄=0.7202, PF=1.1272, WY=1.0804, B=0, M=37}
Figure A3 — Objective History and Preliminary Hyperparameter Importance
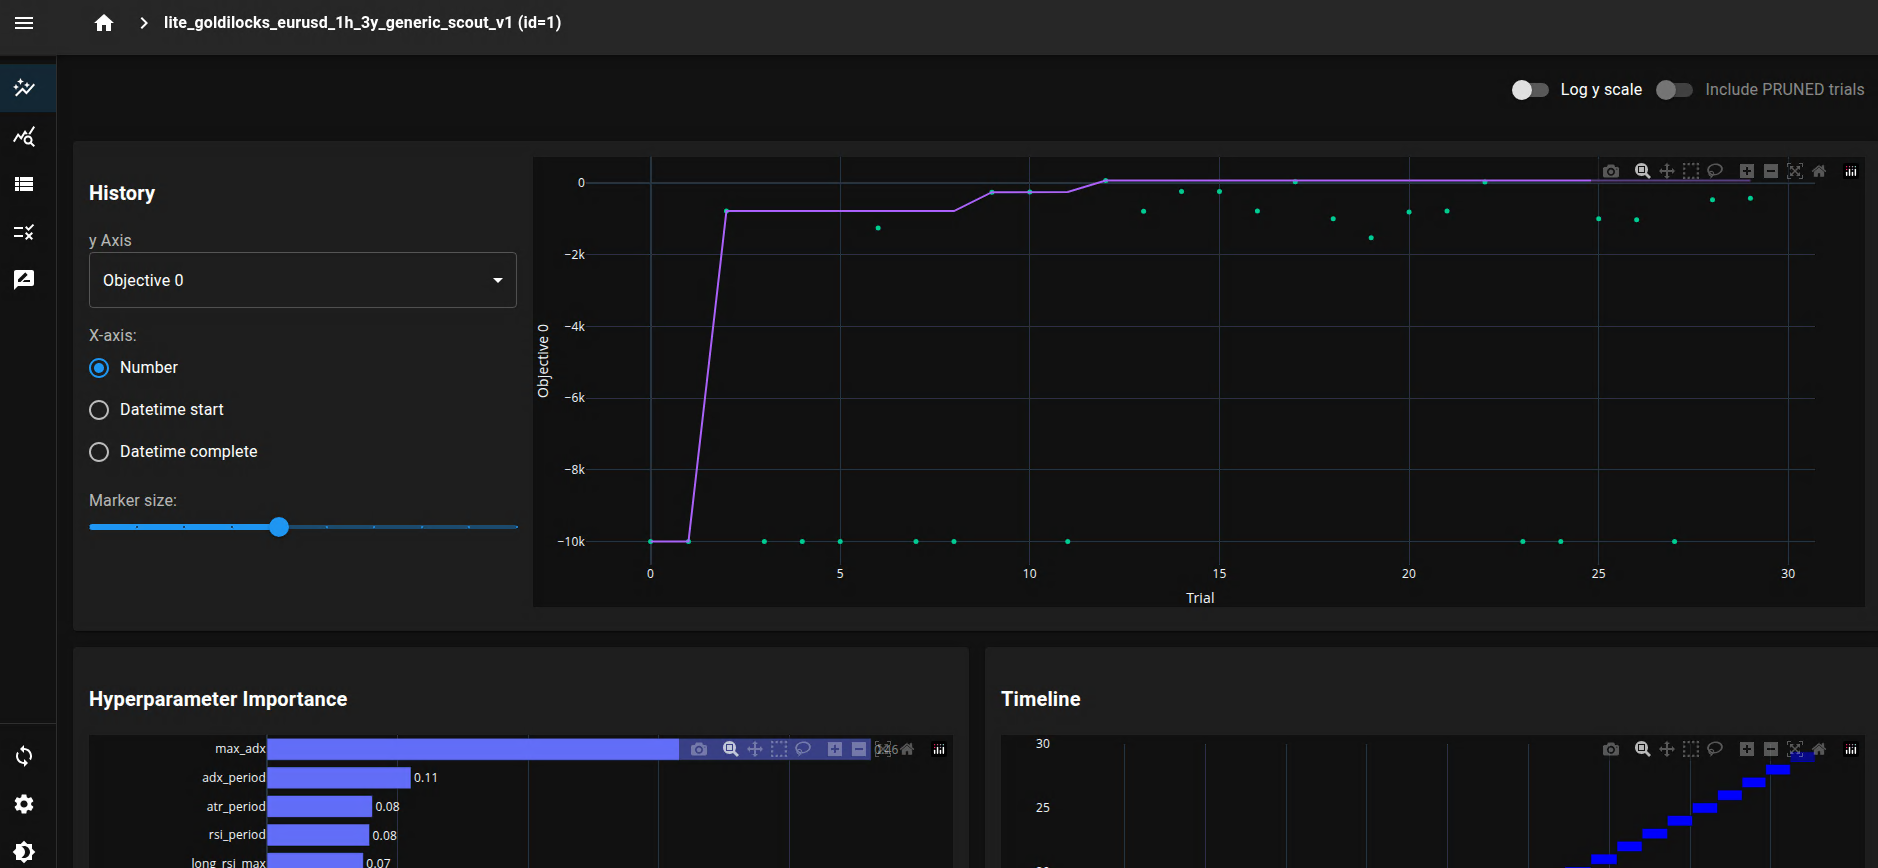
max_adx was the dominant contributor to objective variation in this specific study.
The hyperparameter-importance view is interpreted as an exploratory diagnostic. It estimates which sampled parameters helped explain variation in the Optuna objective score. It does not prove causality or future robustness.
Figure A4 — Parameter Relationship Diagnostics
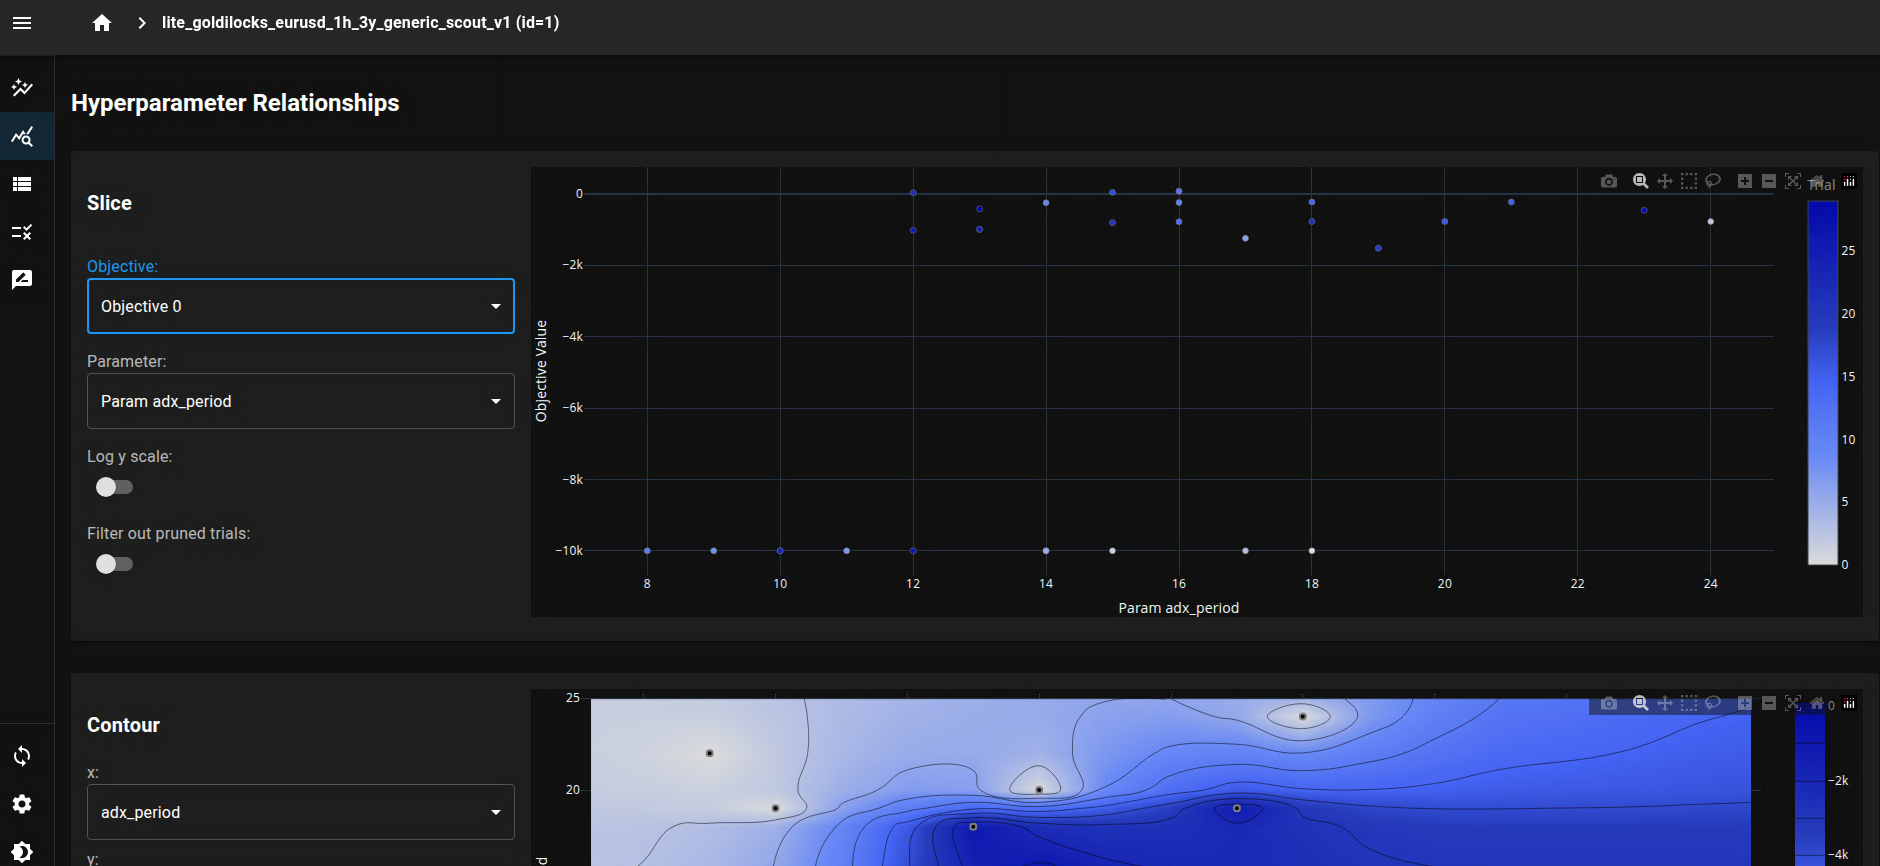
adx_period versus
atr_period.
Apparent structure in these visualisations is not treated as sufficient evidence of robustness. Candidate validity remains dependent on downstream SQL diagnostics, HDBSCAN feature-space clustering, walk-forward validation, embargo controls, veto eligibility review, coded retesting, and demo-live monitoring.